
Case study
Making investment data scannable
Turned dense portfolio data and AI-driven trading signals into a calm, credible platform for accredited investors.
UI Designer
Freelance engagement
→ View prototype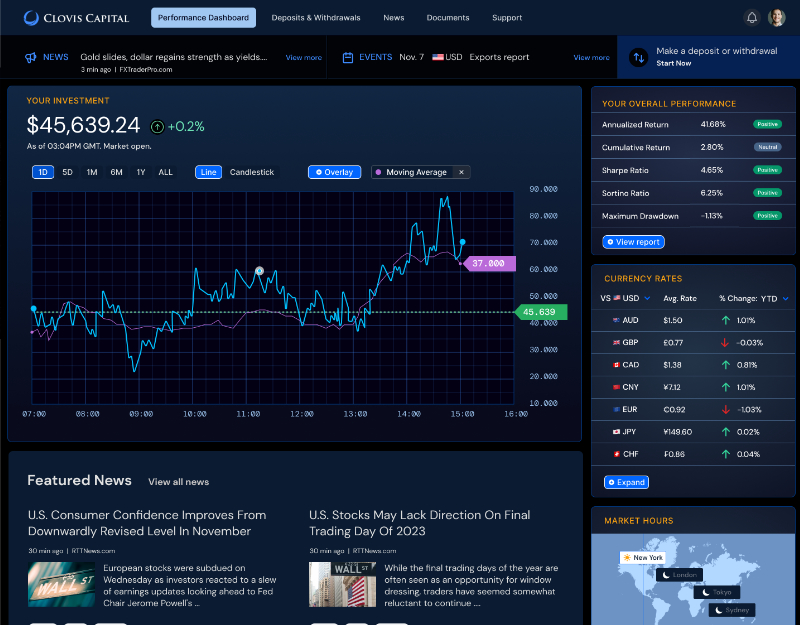
My role
Turned complex requirements into a modular UI system and interactive Figma prototypes.
What changed
Redesigned dashboard, sign-in, deposits/withdrawals, and portfolio analytics flows.
Scope & context
Investor tools often overwhelm users with charts, tables, and metrics competing for attention.
Outcome
An institutional, trustworthy interface with reusable components ready to scale.
Dense data, high stakes
Investors needed to trust what they saw at a glance. The interface had to feel institutional, not experimental, and needed to:
- Present complex financial data without overload
- Build trust through consistency and restraint
- Separate primary metrics from supporting detail
- Grow without redesigning core layouts
Clarity, hierarchy, modularity
Metrics and AI insights were organized into scannable cards, charts, and tables. Restrained type and generous spacing kept key figures like returns and risk prominent while details stayed quiet.
Reusable modules and interactive prototypes aligned stakeholders early and prepared the product for new tools.
Trust starts at sign-in
The login leads with security cues and clear labeling. The dashboard puts high-level metrics first, then groups data into modules with drill-down charts so users never lose context.
Clear steps for financial actions
Deposits and withdrawals replaced dense tables and text-heavy instructions with focused, guided steps.
Results & lessons
A modular system made it easy to add new analytics. For sophisticated users, restraint reads as credibility — removing noise did more than adding features.
Next case study
Rebuilding a client's trust in design